
Trigonometry
Worked Examples
Trigonometric Graphs
We can draw the graphs of the trigonometric functions in the coordinate plane as follows. (See the Graphing section for graphs of other functions.)| Domain | Range | Period | |
|---|---|---|---|
| $\sin$ | $\mathbb{R}$ | $[-1,1]$ | $2\pi$ |
| $\cos$ | $\mathbb{R}$ | $[-1,1]$ | $2\pi$ |

The graph of the function $y=\sin(x)$
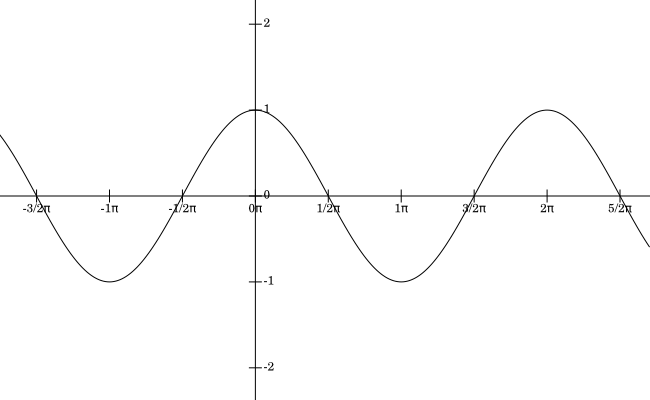
The graph of the function $y=\cos(x)$
Note: The graphs of $y=\sin\left(x\right)$ and $y=\cos\left(x\right)$ are the same except one is a shifted version of the other. For this reason, both their graphs and transformations are called sinusoidal functions:
$$y=a \sin\left(cx-b\right) + d \hspace{30 mm} y=a \cos\left(cx-b\right) + d$$
where $a$ is the amplitude, $b/c$ is the phase shift, the domain is $\mathbb{R}$ and the range is $[-a+d,a+d]$.
| Domain | Range | Period | |
|---|---|---|---|
| $\tan$ | $\mathbb{R}\setminus \{k\pi/2\}, k=\{\pm 1,\pm 3,\ldots\}$ | $\mathbb{R}$ | $\pi$ |
| $\cot$ | $\mathbb{R}\setminus \{k\pi\}, k \in \mathbb{Z}$ | $\mathbb{R}$ | $\pi$ |
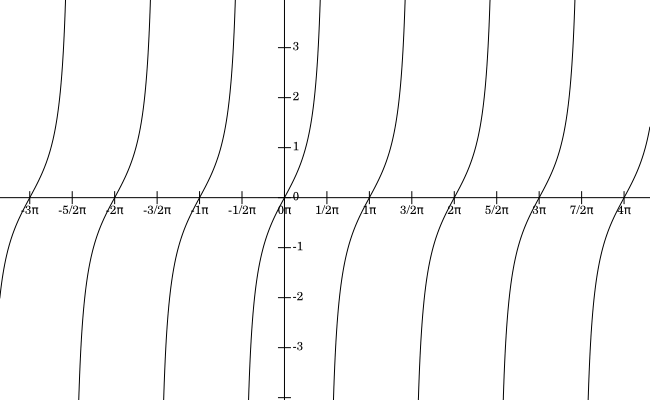
The graph of the function $y=\tan(x)$
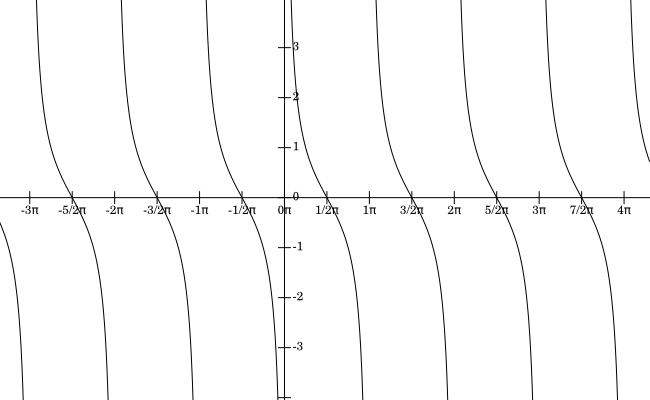
The graph of the function $y=\cot(x)$
| Domain | Range | Period | |
|---|---|---|---|
| $\sec$ | $\mathbb{R}\setminus \{k\pi/2\}, k=\{\pm 1,\pm 3,\ldots\}$ | $\left(-\infty,-1] \cup [1,\infty\right)$ | $2\pi$ |
| $\csc$ | $\mathbb{R}\setminus \{k\pi\}, k \in \mathbb{Z}$ | $\left(-\infty,-1] \cup [1,\infty\right)$ | $2\pi$ |
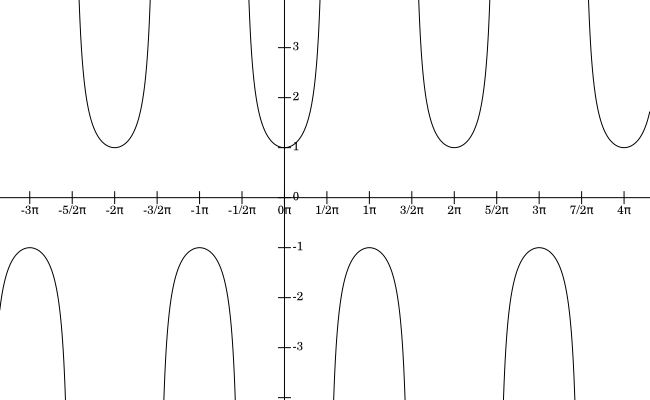
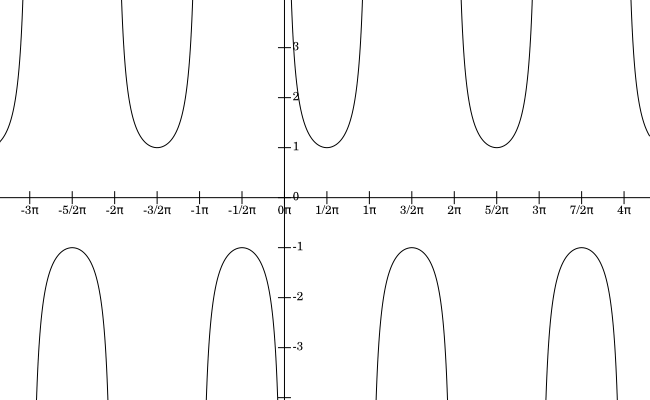
The graph of the function $y=\sec(x)$
The graph of the function $y=\csc(x)$